Patterns in Functional Groups in the AP Composite Fort
THIS PAGE HAS BEEN REMOVED FROM THE OFFICIAL SITE UNTIL I CAN CREATE UP TO DATE DIAGRAMS. THe older diagrams are just too... I think, or maybe i just remove some of them, like Religion!
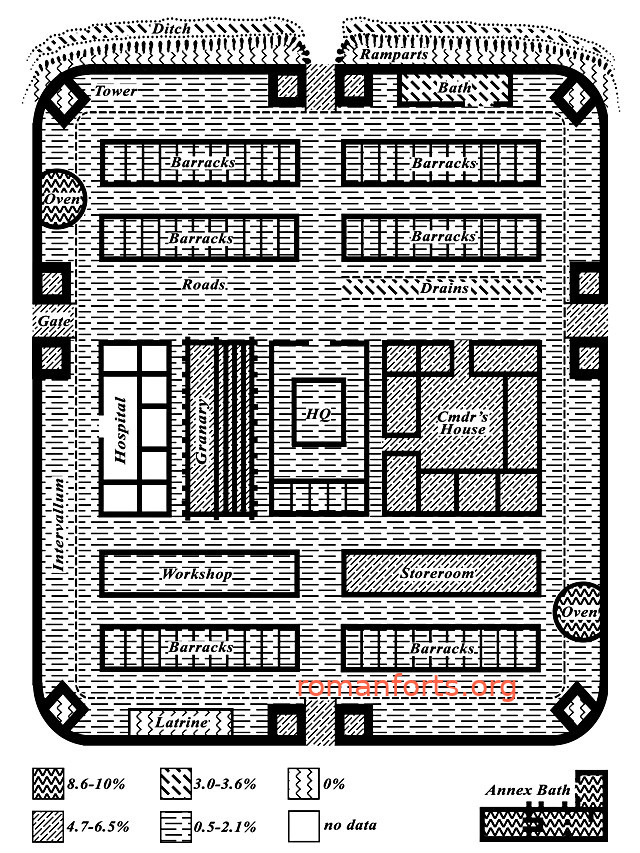
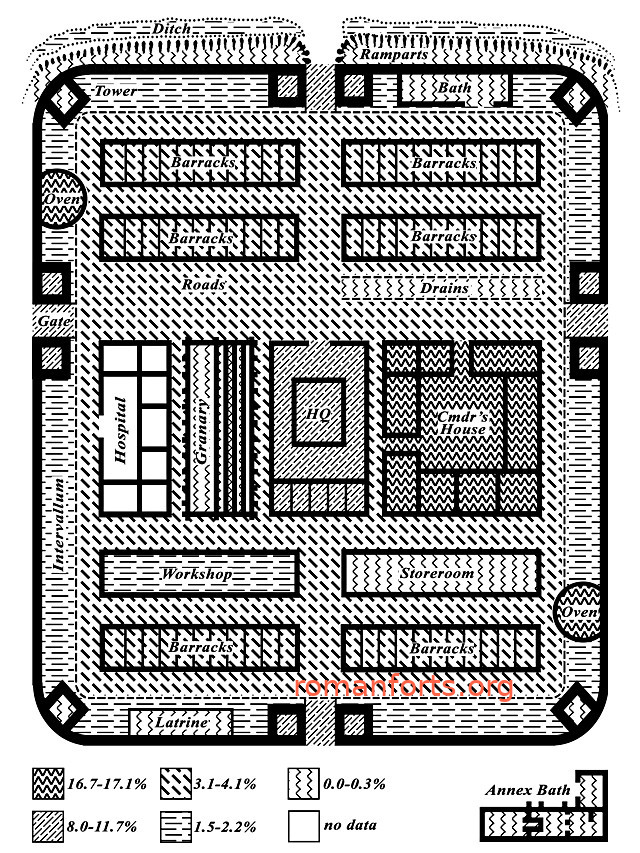
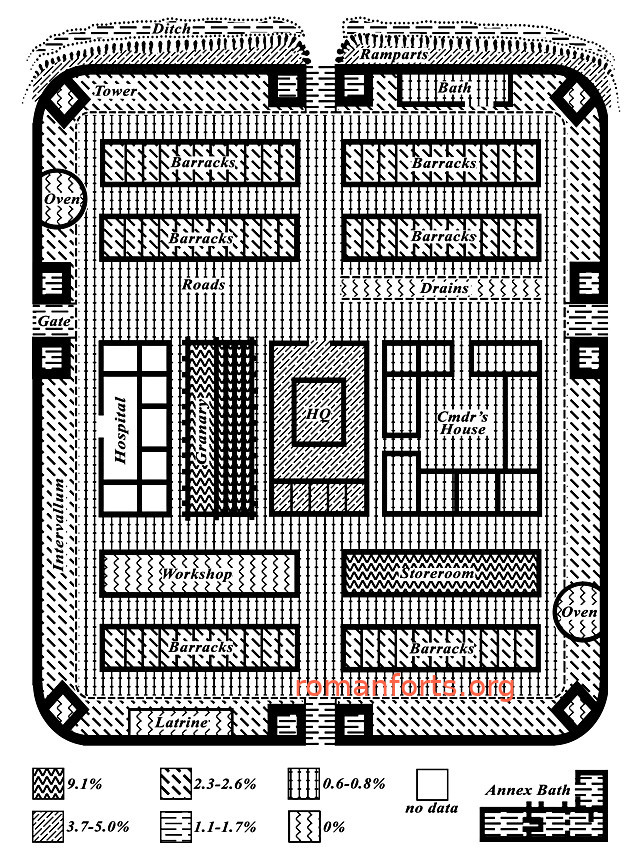
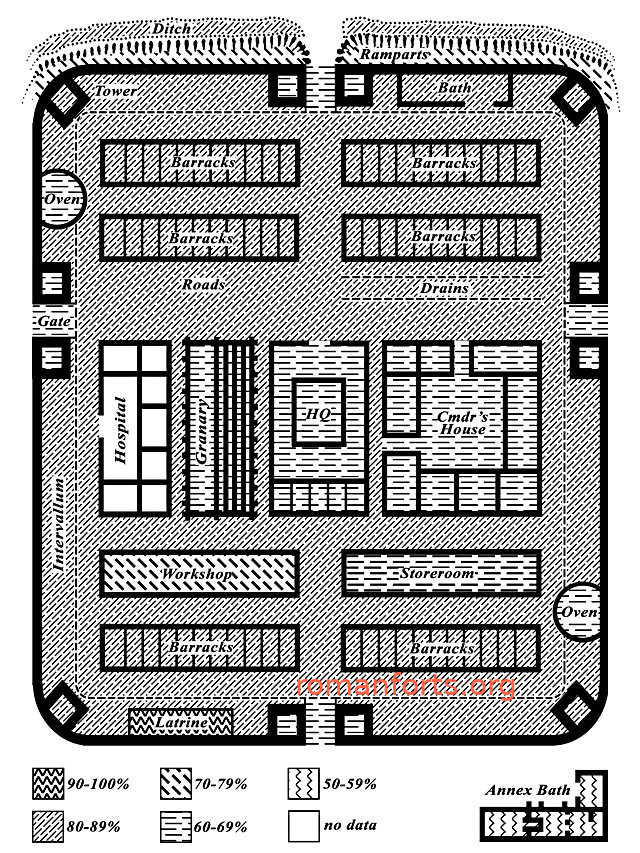
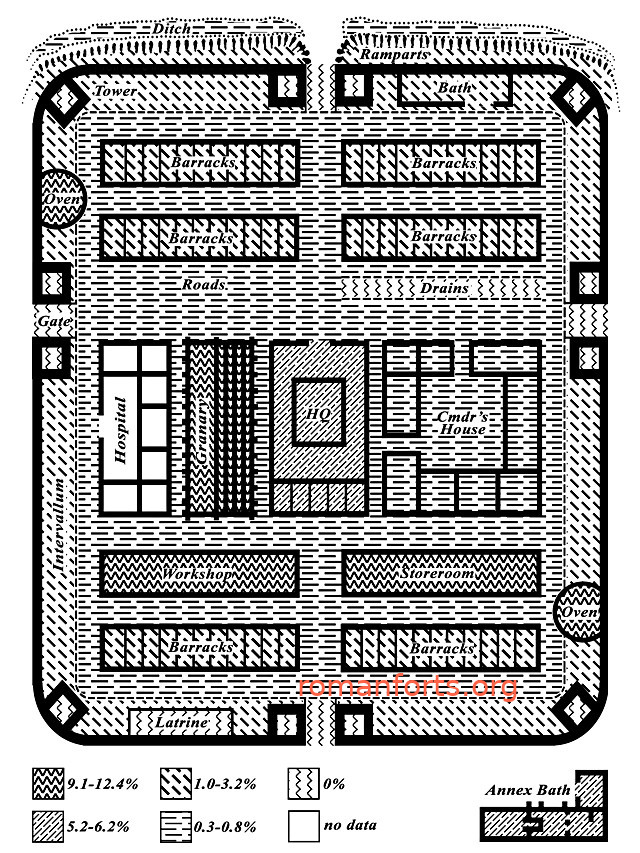
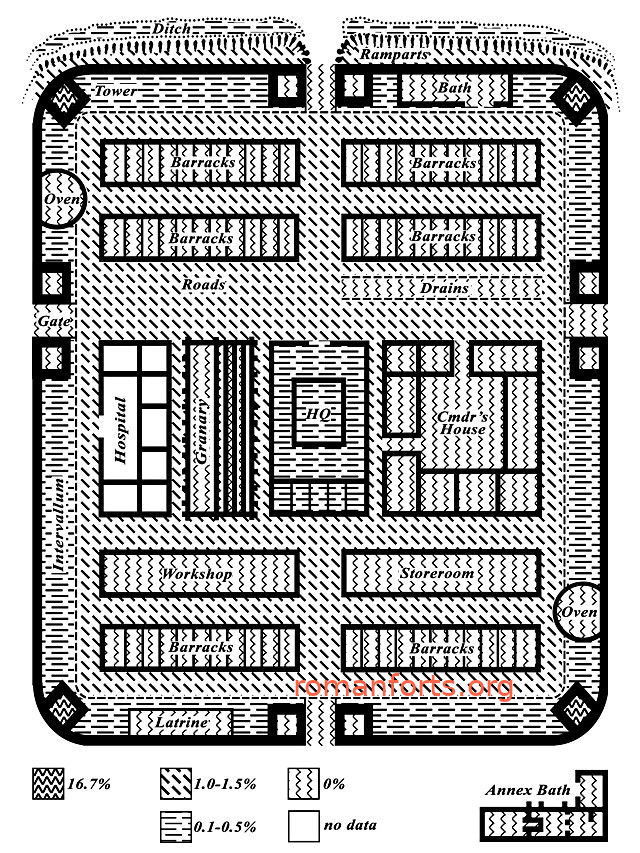
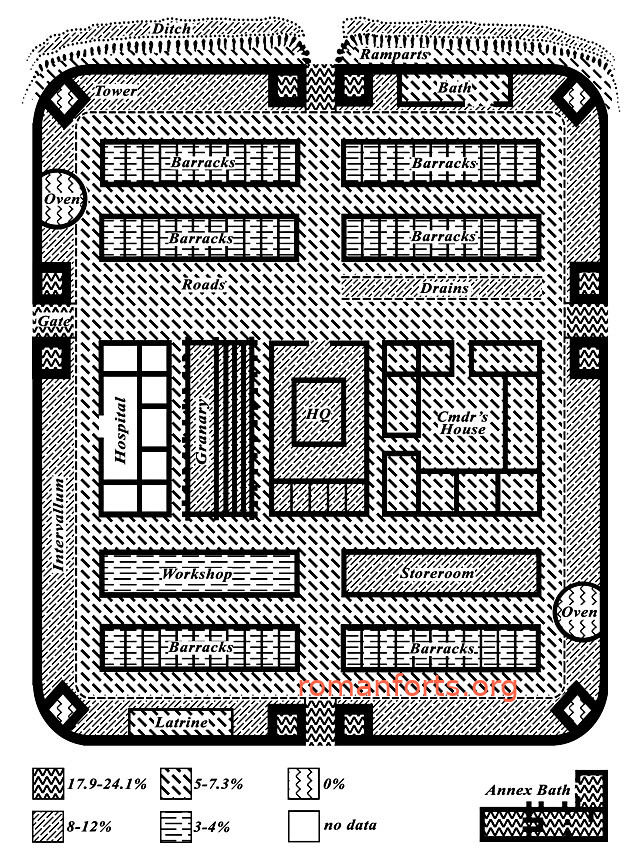
This page presents graphical representations of the different percentage means of each artefact functional group across the Composite Fort. These graphics show the patterns in each functional group's percentage means within the composite fort.
Using the graphics viewer below you can see the functional group percentages diagrammed across the composite fort plan. These diagrams come from the book, Roman Soldiers and the Roman Army and use the data presented in the book. Since publication of the book new data have been added to the study and database, and so the percentage means for each functional group in each sector of the composite fort are slightly different now. Still the general trends in functional group spread across the composite fort remain unchanged, even if the actual percentage means are slightly different. Eventually these static diagrams will be replaced by code which builds the composite fort diagram dynamically, using up-to-date percentage means from the database.